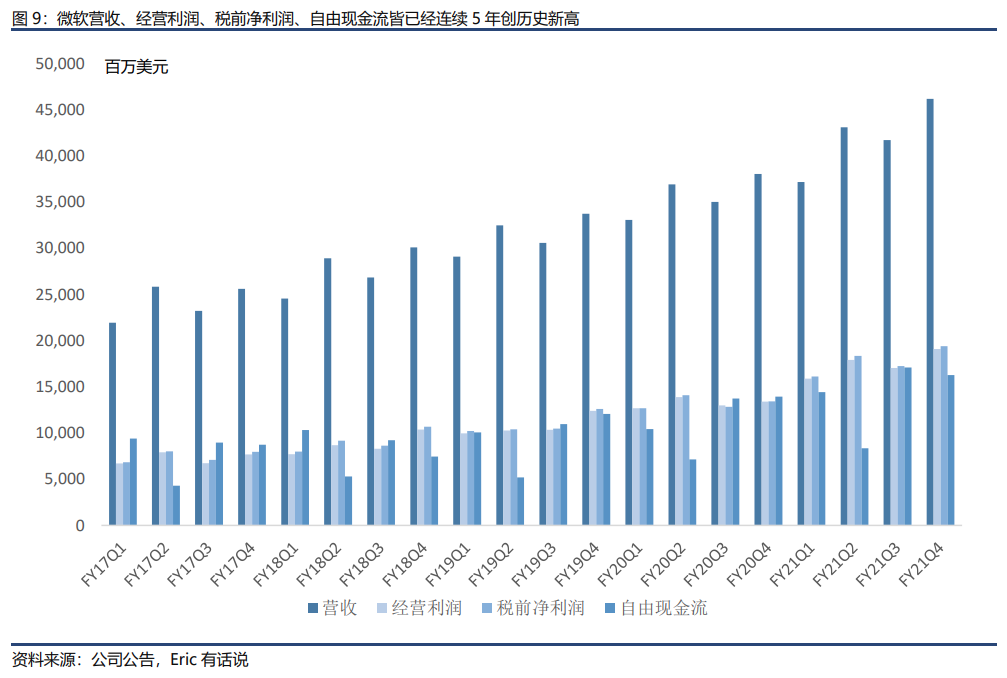
Since its 1986 IPO, Microsoft shares have risen nearly 30,000-fold, outperforming every FAAMG peer and even Apple, which listed five years earlier.
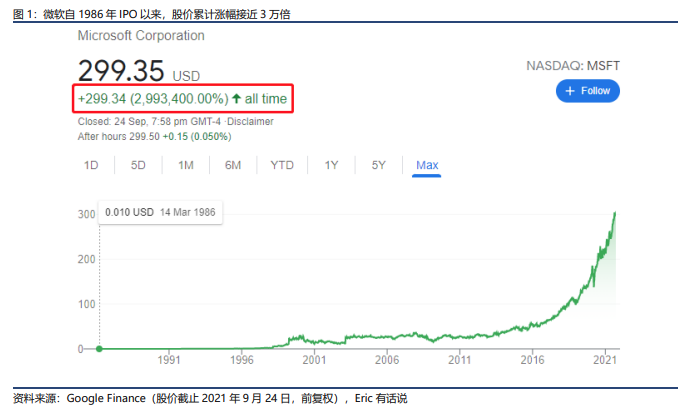
35 Years of Staggering Growth, Free Cash Flow Yield and Dividend Scale Lead FAAMG
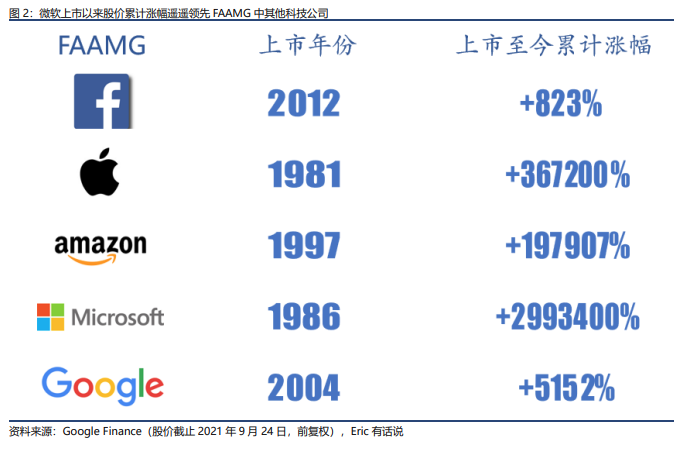
Like the rest of FAAMG, Microsoft's sustained share price appreciation is driven by earnings growth. Microsoft's first annual report as a public company showed FY1987 revenue of $346M, pre-tax net income of $121M, and free cash flow of $1.46M. 35 years later, FY2021 revenue reached $168.088B, a 35-year CAGR of 19%; pre-tax net income $71.102B, CAGR 20%; free cash flow $56.118B, CAGR 35%.
Compared with Apple, the earliest-listed FAAMG member, Apple's 34-year revenue CAGR is 15%, pre-tax net income CAGR 16%, and free cash flow CAGR 21%.
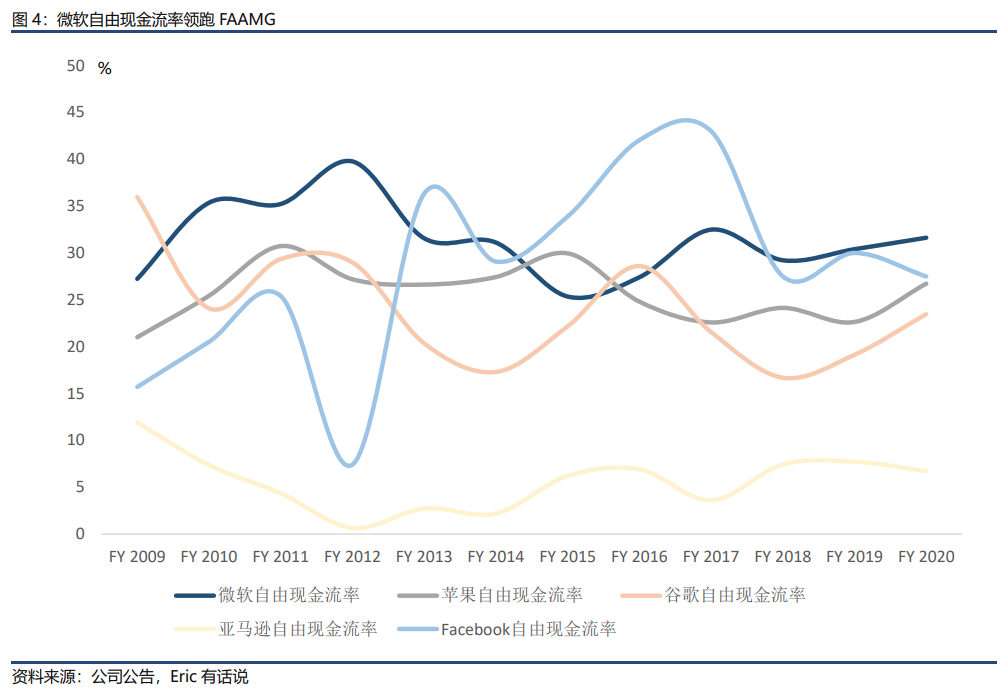
Benefiting from a superior business model, Microsoft's free cash flow margin has long been stable above 30%, and has risen steadily since FY2018, increasing for three consecutive fiscal years. By contrast, software platform peer Facebook and hardware-leaning Apple maintain free cash flow margins around 25%, while Amazon's stays in the single digits.
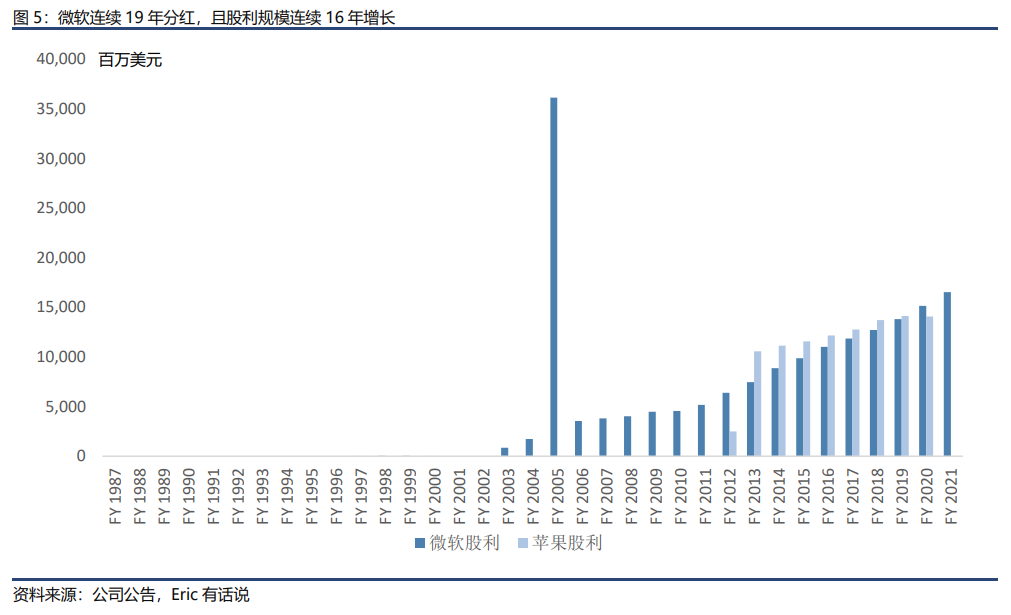
On shareholder returns, Microsoft has paid dividends for 19 consecutive years, with the dividend amount growing for 16 straight years; FY2020 dividend scale exceeded Apple's. In FY2005, Microsoft announced a $44B+ shareholder return plan, including $36.1B in dividends and $8B in buybacks. Notably, among FAAMG, only Microsoft and Apple pay dividends.
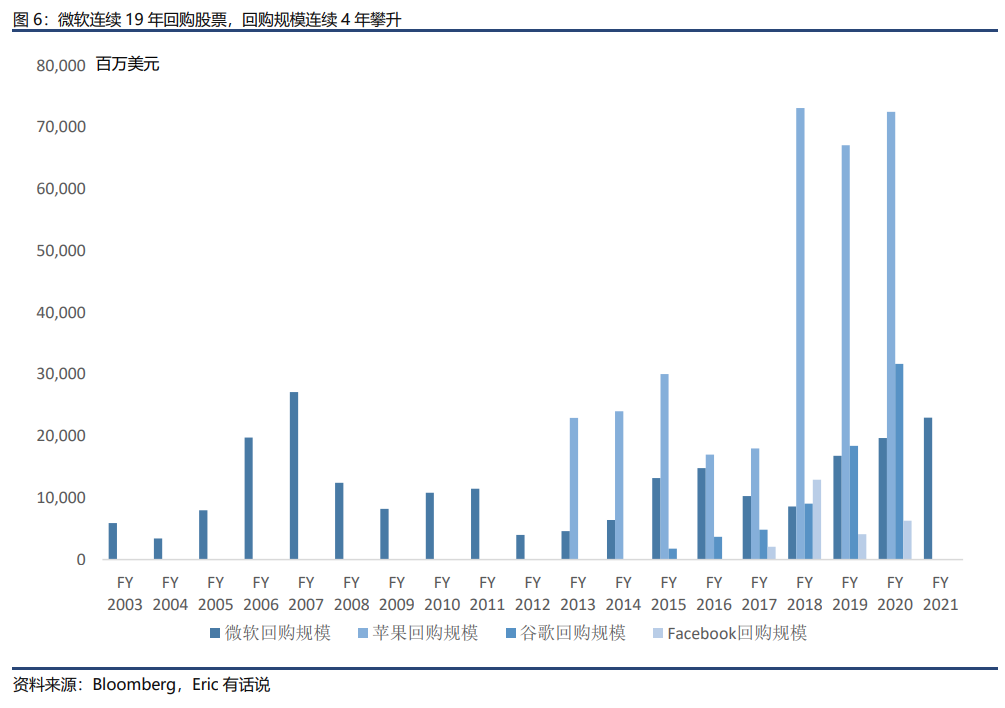
Beyond dividends, share buybacks have become a common tool for tech companies to support sentiment and signal management confidence. Four FAAMG members—Facebook, Apple, Microsoft, and Google—conduct frequent, large-scale buybacks.
Per Bloomberg, Microsoft began buybacks in FY2003 and has repurchased shares for 19 consecutive years, with buyback amounts rising for four straight years. FY2021 buybacks reached $22.97B, the second-highest in Microsoft's history. In September 2021, alongside an 11% quarterly dividend increase, the board authorized a $60B buyback, the largest ever. Microsoft's balance sheet currently holds about $130.3B in cash, equivalents, and short-term investments.
Global Digital Wave Arrives, Microsoft Opens Second Growth Curve
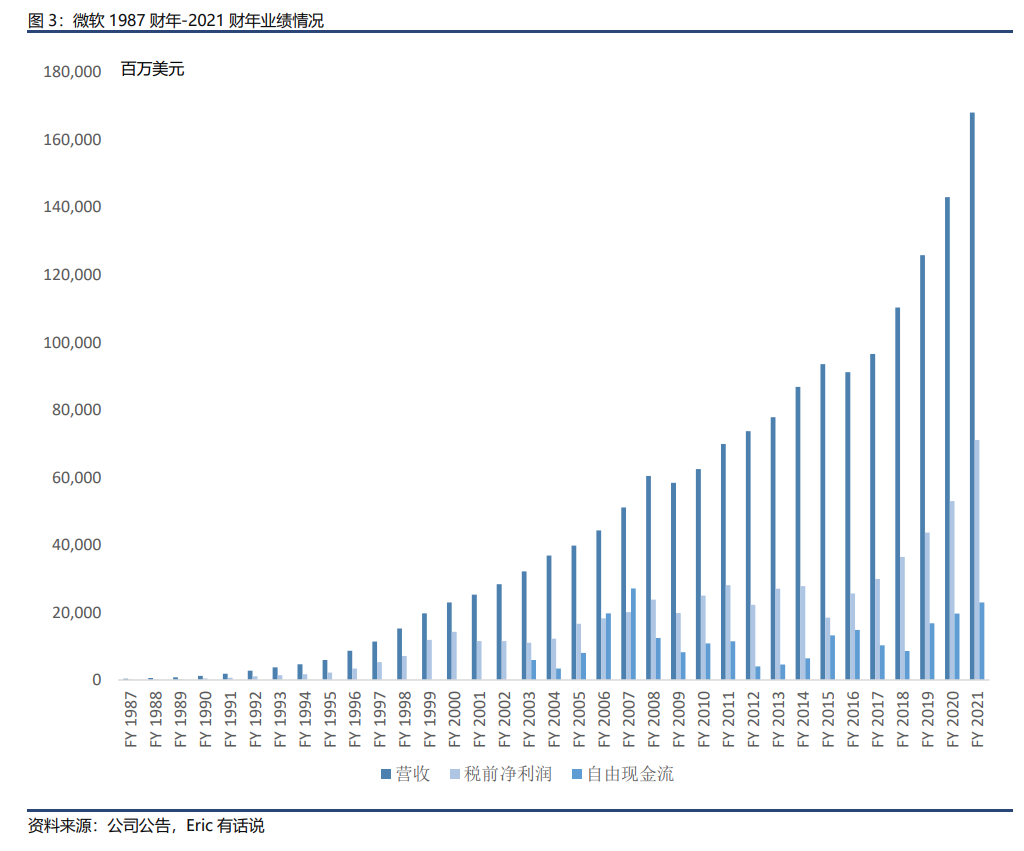
Since the turn of the century, global enterprises have undergone digital transformation, accelerating over the past decade. As the world's largest software company, Microsoft has been a primary beneficiary. Reviewing FY2000-FY2021 (Microsoft's fiscal year ends June 30) revenue and pre-tax profit reveals two distinct growth curves with different slopes:
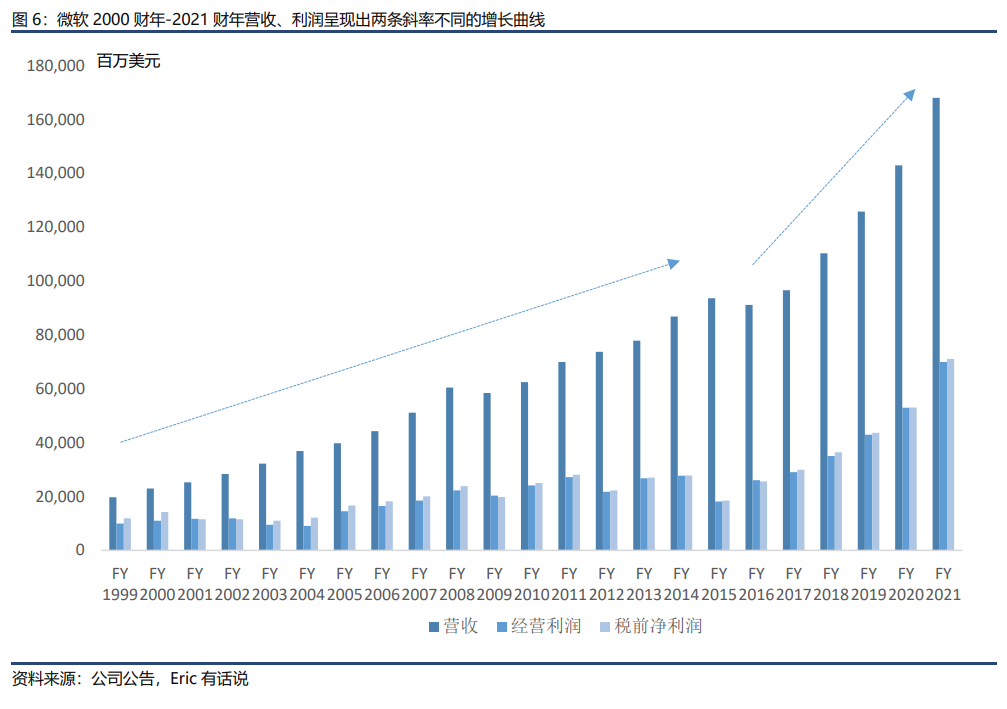
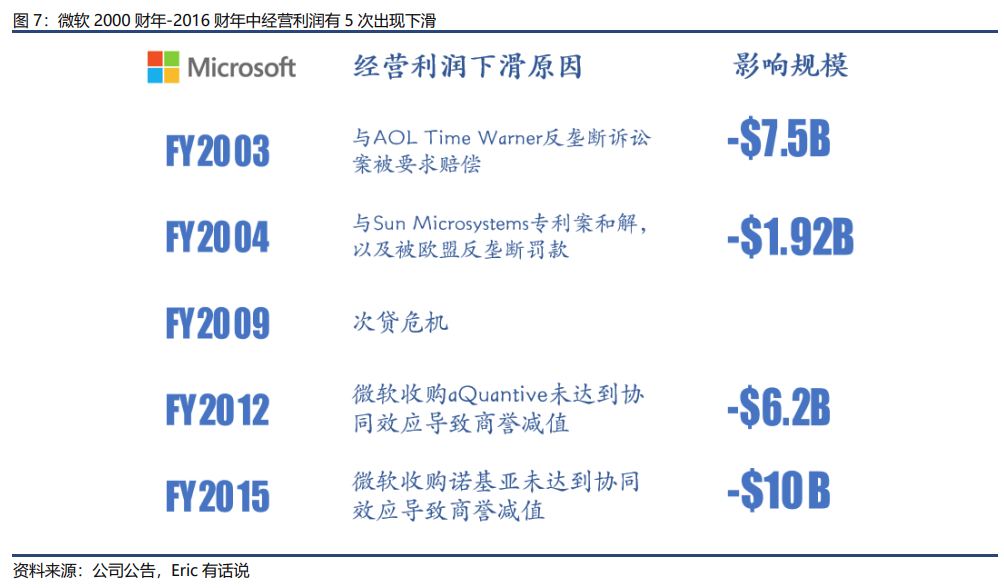
FY2000-FY2016: revenue average growth 10%, operating income average growth 8%. Only FY2009 saw a revenue decline, while operating income declined five times: FY2003 (AOL Time Warner antitrust), FY2004 (Sun Microsystems settlement and EU fine), FY2009 (subprime crisis), FY2012 (aQuantive goodwill impairment), FY2015 (Nokia goodwill impairment).
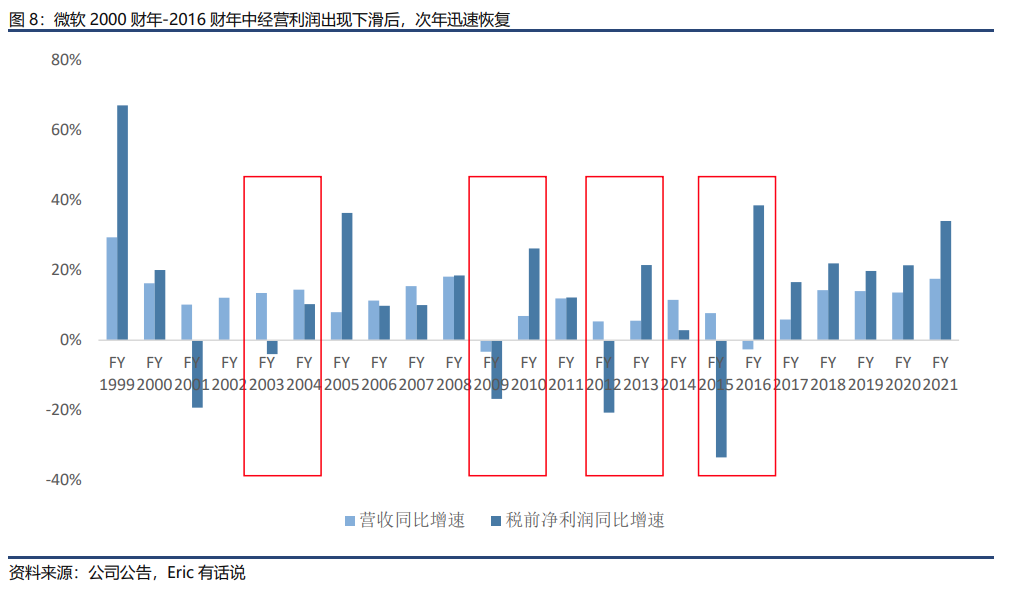
FY2017-FY2021: revenue average growth 13%, operating income average growth 22%, with profit growth consistently exceeding revenue growth by over 10 percentage points. Notably, revenue, operating income, pre-tax net income, and free cash flow have all set records for five consecutive years, launching a steeper second growth curve.