
Marvell FY24Q4 corresponds to calendar November/December 2023 and January 2024.
Marvell FY24Q4 Earnings:
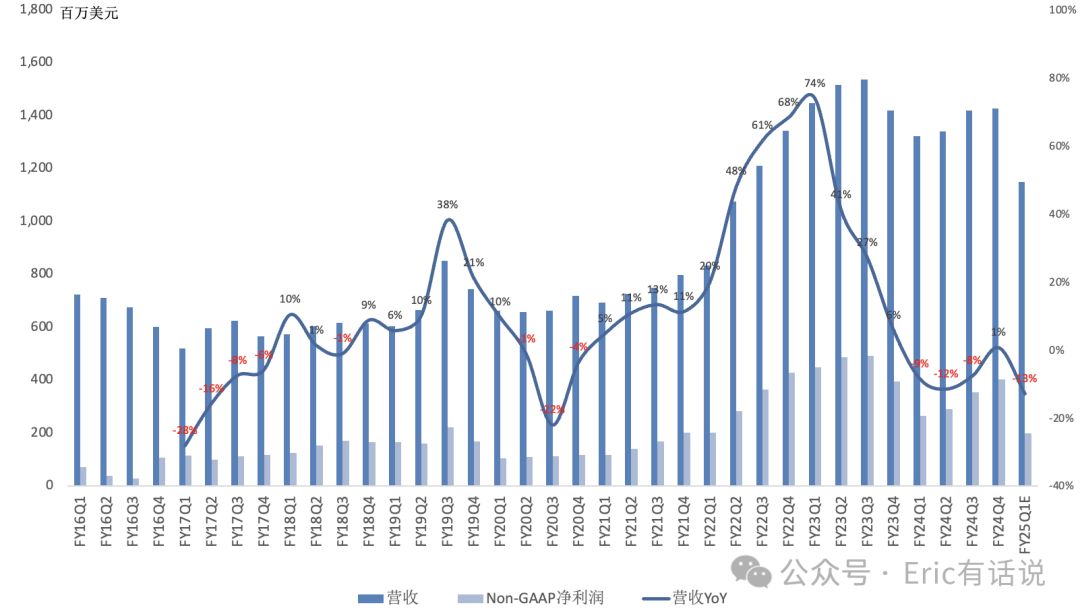
Revenue $1.427B, up 1% year over year, ending three consecutive quarters of year-over-year decline, up 1% sequentially.
GAAP gross margin 46.6%, down 0.9 percentage points year over year, up 7.7 percentage points sequentially; Non-GAAP gross margin 63.9%, up 0.4 percentage points year over year, down 0.1 percentage points sequentially.
Non-GAAP operating profit $483M, up 3% year over year, ending four consecutive quarters of year-over-year decline; Non-GAAP operating margin 33.8%.
Non-GAAP net income $402M, down 1% year over year; Non-GAAP net margin 28.2%.
GAAP days in inventory 106 days, up 8 days sequentially, ending three consecutive quarters of sequential decline.
Mainland China revenue share 39%, US 14%, Singapore 8%, Malaysia 7%, Finland 6%, Taiwan 4%, Thailand 3%, Japan 3%, Philippines 1%.
This quarter repurchased $100M, dividends $52M; board authorized additional $3B repurchase, cumulative remaining authorization $3.3B.
By Business, Q4:
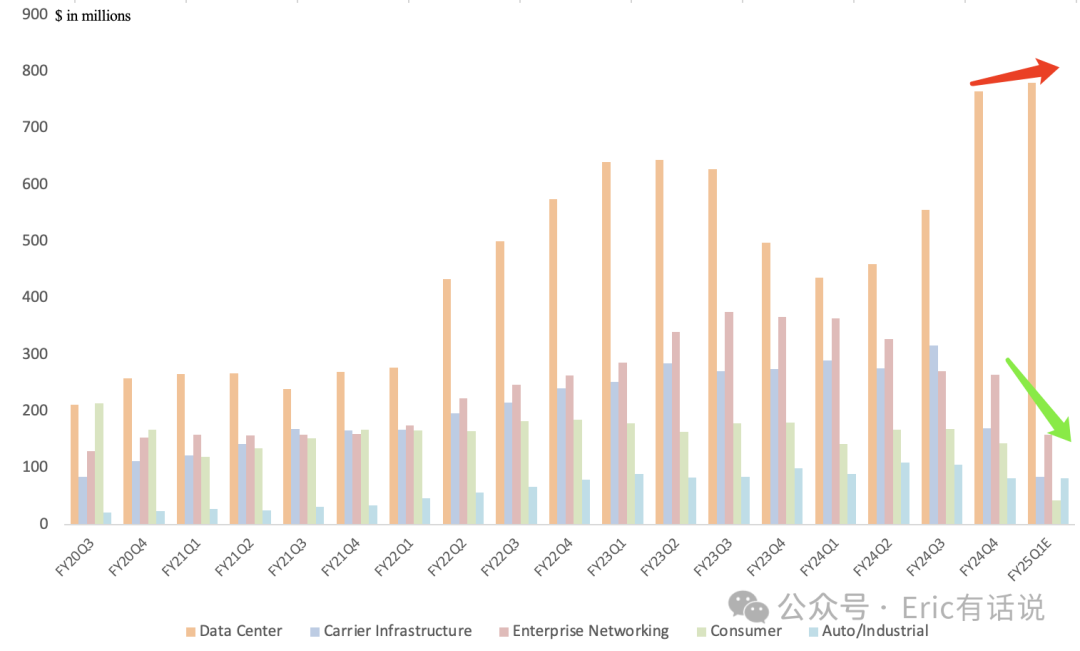
Data center revenue $770M, up 54% year over year, 54% of revenue; driven by cloud data center growth, both AI and non-AI up sequentially, growth to continue through 2024; Q4 800G PAM optical products grew rapidly, 1.6T PAM products in customer validation, shipping by year-end; 800G penetration to rise over coming years; PAM DSP for AEC market ramping, customers primarily tier-1 cloud; 400G DCI module shipments strong, 800G DCI strong customer interest, continued design wins, ramping next year; data center storage products and Teralynx switch up sequentially, Teralynx 12.8T shipping, next-gen 51.2T volume production by year-end; Q1 optical products to remain strong, but enterprise on-prem data center products down sequentially.
Custom silicon begins shipping in Q1 this year, currently two AI compute programs covering 5nm and 3nm, volume ramp in H2, Q4 to contribute over $200M revenue, run rate revenue over $1B, demand visibility through 2025; like Broadcom, custom silicon gross margin naturally below company average.
2023 AI contributed 10%+ of revenue (~$600M), 2022 was 3% (~$200M); 2023 Q4 AI revenue $200M+, mostly optical; 2024 optical revenue growth to track AI accelerator shipments; based on this, 2024 full-year AI revenue (optical + custom silicon) estimated at $1.5B-$2B.
Enterprise networking revenue $270M, down 28% year over year, 19% of revenue, weak demand.
Carrier infrastructure revenue $170M, down 38% year over year, 12% of revenue, weak demand.
Consumer revenue $140M, down 20% year over year, 10% of revenue, weak demand.
Auto/industrial revenue $110M, down 17% year over year, 6% of revenue, mainly weak industrial demand; auto revenue up double digits full year, benefiting from Ethernet demand growth in EVs and ICE vehicles.
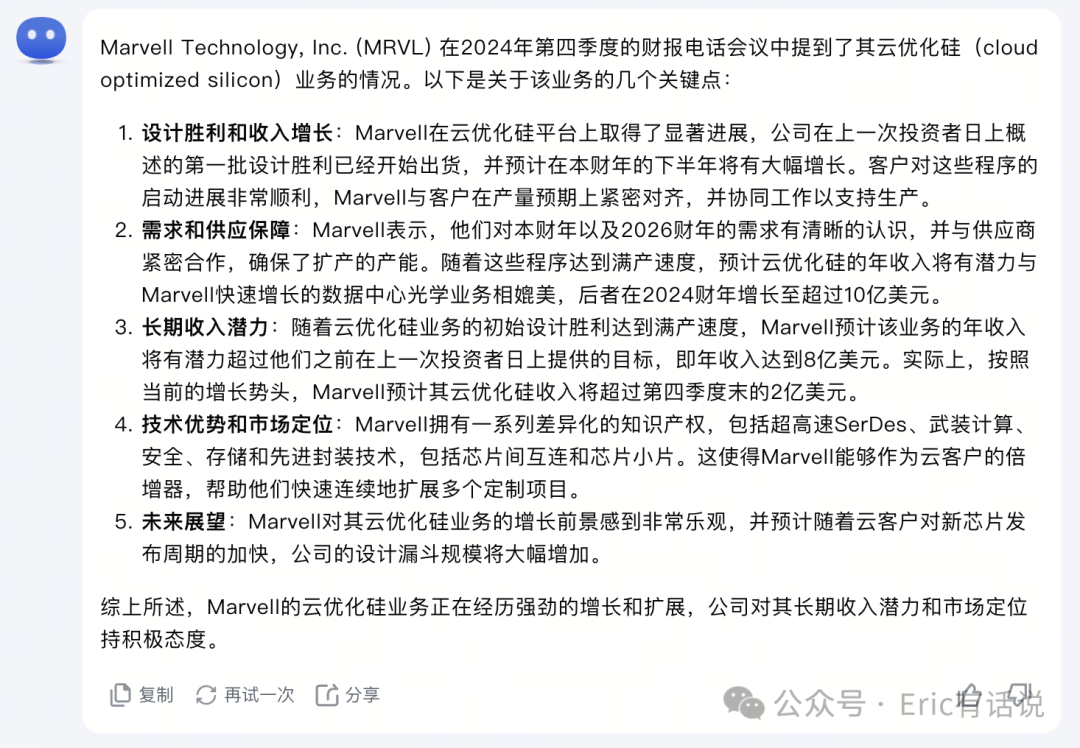
Kimi's summarization capability is pretty good.
Outlook:
Q1 data center revenue expected to grow low-single-digits sequentially, both AI and non-AI up sequentially.
Q1 carrier infrastructure expected to decline 50% sequentially.
Q1 enterprise networking revenue expected to decline 40% sequentially.
Q1 auto/industrial revenue expected flat sequentially, due to weak industrial demand.
Q1 consumer revenue expected to decline 70% sequentially, due to severely weak game console demand.
Carrier and enterprise networking expected to bottom in Q1, recover in H2; once normalized, both segments to exceed $1B annualized revenue each, combined over $2.5B in a strong cycle.
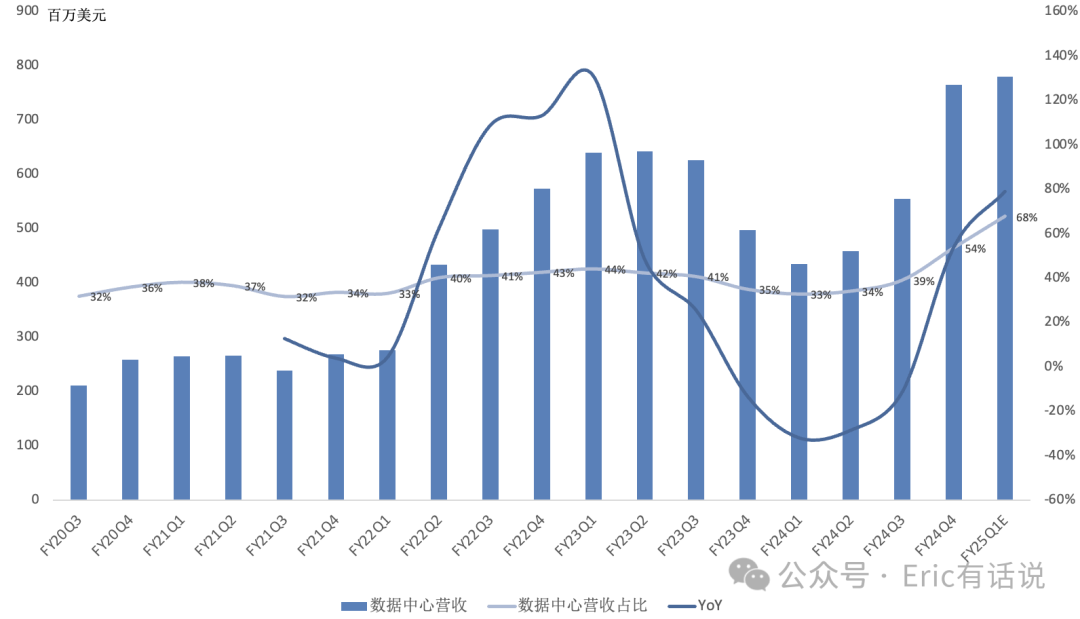
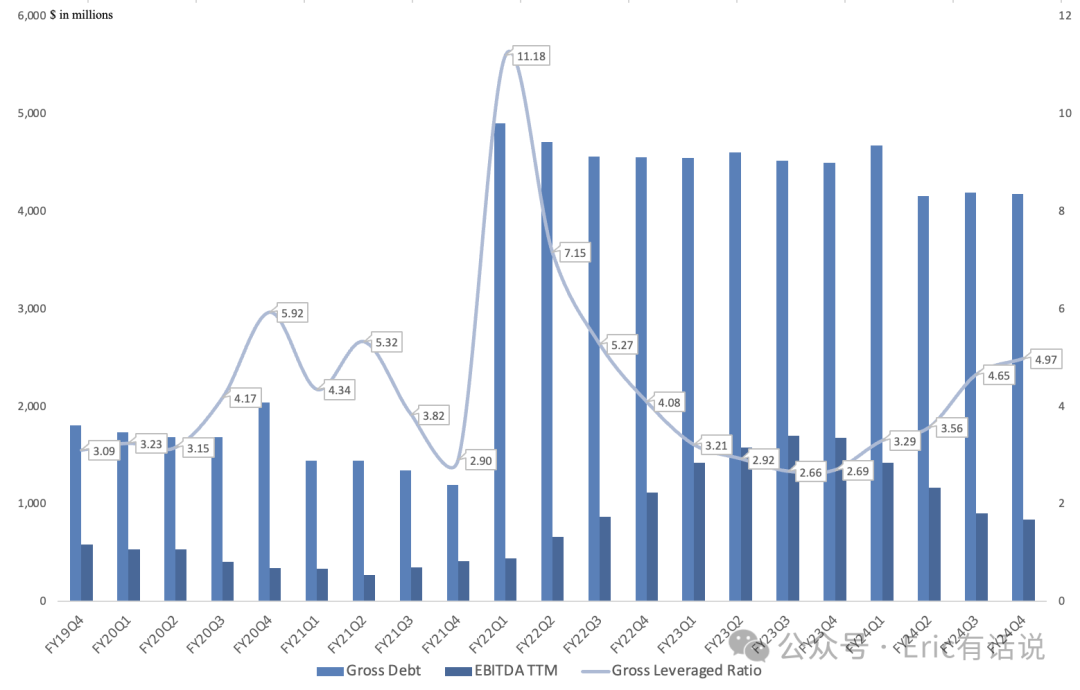
Overall, Marvell's report is grim. AI business is indeed growing, but the speed of traditional business decline is staggering, far worse than Broadcom.
In the previous earnings report, it was noted that '2024 full-year revenue significant growth probability may be small.' Optimistic scenario: if management's Q1 bottom and H2 recovery holds, 2024 revenue estimated at $5.3B-$5.9B, at best single-digit growth, still below the prior memory cycle peak. Profit pressured by weak high-margin traditional business, Non-GAAP net income expected to trough around $1.1B (current $62B market cap, ~56x PE) vs historical peak $1.8B (current $62B market cap, ~34x PE), a meaningful gap. Management pins hopes on 2025 full-throttle performance, but margins are concerning.